

How Companies Manage Modern Chart of Accounts
Super Admin
A modern chart of accounts (COA) is a structured list of financial accounts in an accounting system that categorizes every dollar a company earns, spends, owes, or owns. US businesses manage it by standardizing account numbers, using multi-dimensional tags for departments, automating journal entries, and linking the general ledger to sales, billing, and inventory workflows for faster reporting.
Managing everyday finances across different sales channels, vendors, and teams requires simple, well-structured recordkeeping. Growing businesses rely on Flow Ledger Pro to keep their core financial records balanced and clean. At the heart of this operational setup is a well-planned chart of accounts, which acts as the master filing cabinet for all business transactions.
When a company organizes its ledger accounts correctly, daily bookkeeping becomes straightforward, audits run smoothly, and leadership can clearly see where cash is moving at any given moment.
What Is a Chart of Accounts in Business Accounting?
A chart of accounts is an organized index of every account used to record financial data in a company general ledger. Every time a business sells a product, pays a utility bill, or buys new tools, the transaction is sorted into an account from this list.
In modern cloud accounting systems, the chart of accounts is not just a static sheet of paper. It connects directly with daily workflows like customer invoicing, inventory tracking, supplier payments, and bank feeds. This live connection helps accountants record numbers without manual data entry.
How Is a Standard Chart of Accounts Structured?
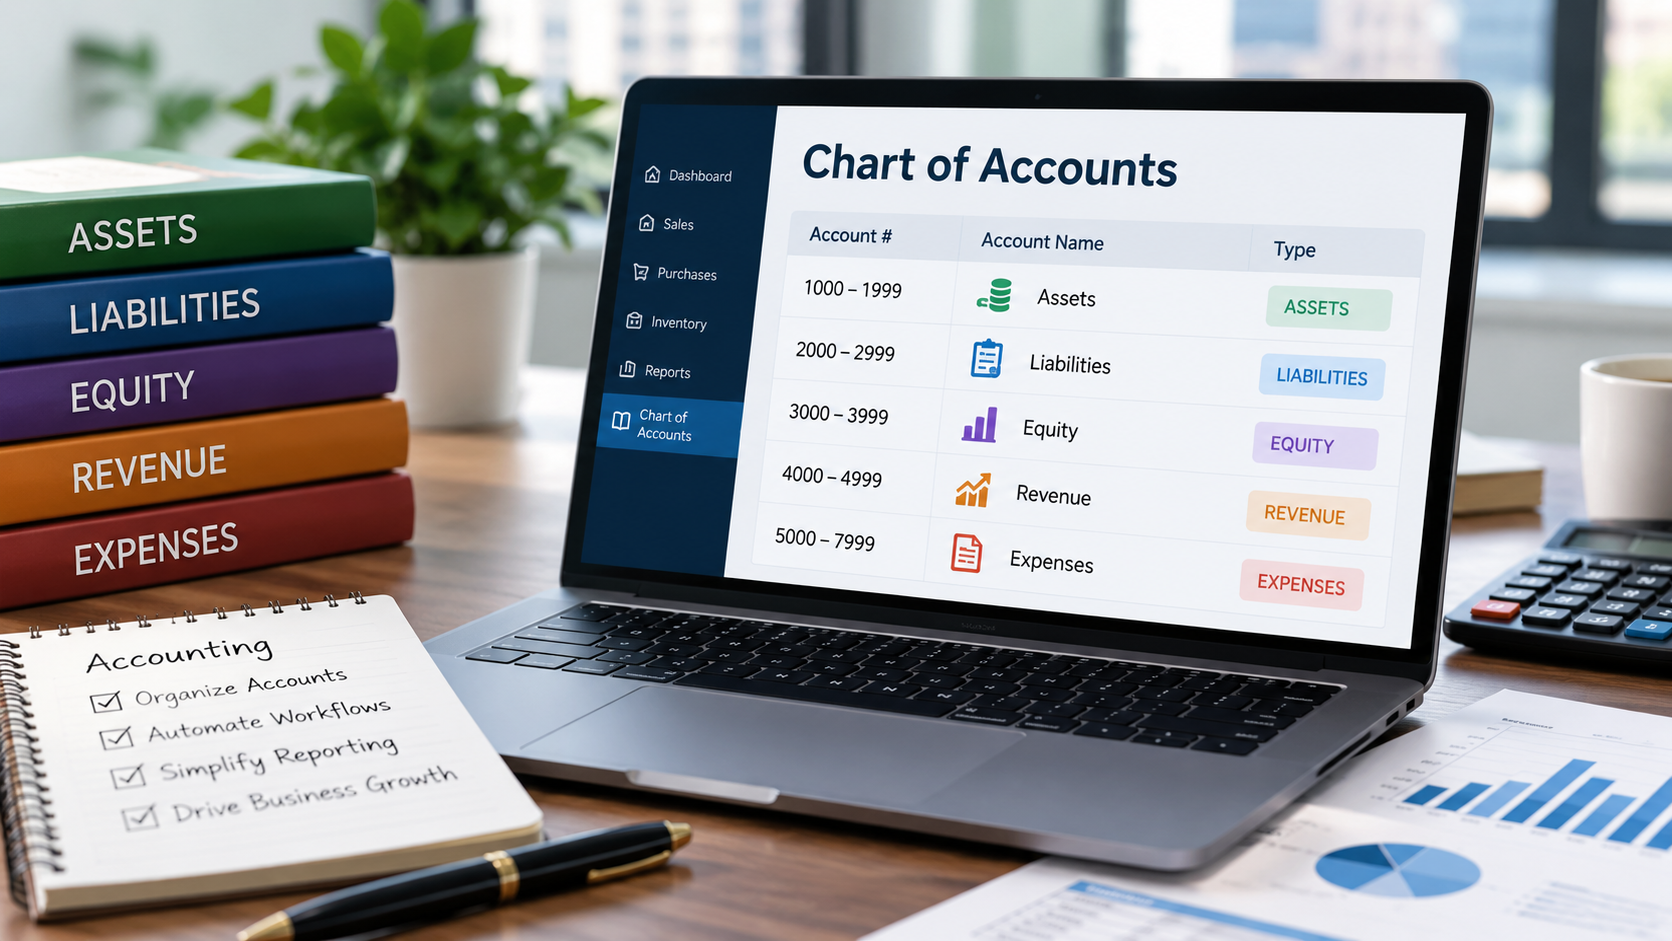
Most US businesses structure their chart of accounts using a standard five-category numbering system. Each category receives a specific block of numbers to keep reports organized and easy to read.
1000–1999 (Assets): What the business owns. This includes checking accounts, petty cash, accounts receivable, warehouse inventory, and equipment.
2000–2999 (Liabilities): What the business owes. Examples include unpaid vendor bills (accounts payable), credit card balances, payroll taxes, and bank loans.
3000–3999 (Equity): The net worth of the business. This covers owner investments, common stock, and retained earnings kept in the business.
4000–4999 (Revenue): Money earned from selling products, offering services, or receiving interest.
5000–7999 (Expenses): Costs to run the business. This includes cost of goods sold, rent, team salaries, office supplies, advertising, and insurance.
How Do Companies Organize Their Chart of Accounts Today?
Old accounting methods created separate account lines for every tiny detail, such as having five different travel accounts for five different team members. Today, modern organizations manage their ledgers using simpler, smarter practices.
1. Using Tags Instead of Hundreds of Sub-Accounts
Modern finance teams keep their main list of accounts short and clear. Instead of creating ten separate marketing accounts for different projects, they use a single general marketing expense code and attach simple tags for project names, departments, or office locations. This prevents clutter while still giving managers deep reports.
2. Standardizing Chart of Accounts Rules Across Locations
When a business operates in multiple states or runs more than one brand, keeping account numbers the same across every entity is critical. Using the exact same numbering rules makes it easy to combine financial statements at the end of each month.
3. Connecting the General Ledger to Business Operations
A chart of accounts works best when it receives data automatically from daily operations:
Customer Payments: Invoices automatically log revenue and update accounts receivable balances.
Vendor Bills: Purchase orders route straight to accounts payable once items arrive.
Stock Movements: Sales automatically adjust warehouse stock values and cost of goods sold.
4. Setting Strict User Access for Accounting Records
To keep the list clean, companies allow only senior accountants or controllers to create new accounts. Restricting permissions stops team members from accidentally creating duplicate accounts that confuse end-of-year tax filings.
Real-World Chart of Accounts Examples
Case Study 1: Clean Accounts for an E-Commerce Brand
A growing consumer goods brand in Ohio was selling across three online platforms. Their bookkeeper had created separate expense accounts for every single shipping carrier, software app, and packaging supplier. The ledger grew to more than 600 individual accounts, making monthly reconciliations take over two weeks.
The team cleaned up the list by archiving inactive accounts and grouping operational costs into four main buckets: Merchant Fees, Shipping Supplies, Freight, and Software. They used tags to track the specific selling channel. This cut their total account list down to 75 core accounts and dropped their monthly close time from 14 days down to 3 days.
Case Study 2: Managing a Chart of Accounts for Multi-State Services
A regional HVAC and repair company operating across Texas and Oklahoma needed clear visibility into regional job profits. Previously, each branch manager entered transactions under different names, making company-wide comparisons almost impossible.
The company rolled out a standardized chart of accounts across all branches. Every location adopted the exact same account numbers for parts, vehicle fuel, technician payroll, and service income. By pairing uniform account numbers with branch location tags, the owner could compare operating margins across all service locations within minutes.
Conclusion
A well-structured chart of accounts is the core foundation of clean business accounting. By standardizing account numbering, keeping account lists lean, and connecting the general ledger directly to daily sales and purchasing workflows, companies can eliminate guesswork from their finances.
Taking the time to build a logical account structure ensures reliable numbers, simplified tax seasons, and clear financial clarity as your business grows.
Frequently Asked Questions
Quick answers to common questions about this topic
Ready to Transform Your Accounting?
Join hundreds of businesses using Flow Ledger Pro to streamline their financial operations.